Alternative Market Size

The $118.84 Billion Automation Trap: Why Smart Pallets Still Waste Money
Mordor's $118.84B projection celebrates automation accelerating consumption—companies invest $50,000-200,000 per site for equipment compatibility. Brambles' sustainability program (550,000+ IoT trackers, planting 2 trees per harvest) represents the most sustainable consumption model, not elimination.
Published By:
Fortune Business Insights
The Industry's Automation Promise
Mordor Intelligence projects the pallets market will reach $118.84 billion by 2031, with automation driving growth. The narrative sounds compelling:
Block pallets enable 15-30% faster handling
RFID tracking optimizes asset utilization
Robotics require dimensionally consistent platforms
IoT sensors provide supply chain visibility
But here's what the data actually reveals: businesses are spending billions to automate an inefficient system rather than eliminate the inefficiency.
The $200,000 Compatibility Tax
Research shows that "deviation from the reference block specification can trigger $50,000-$200,000 recalibration costs per site."
Think about what this means:
Warehouse automation requires exact pallet dimensions
Any variance forces expensive system recalibration
Companies are locked into specific pallet specifications
Innovation is constrained by existing automation infrastructure
You're not automating for efficiency. You're automating yourself into vendor lock-in.
The Real Cost:
Scenario | Investment | Result |
|---|---|---|
Automated warehouse setup | $50,000-200,000 per site | System calibrated to standard pallet dimensions |
Non-standard pallet adoption | $50,000-200,000 recalibration | Required if switching pallet specifications |
Continuous stretch wrap | $36,500/year (50 pallets daily) | Not addressed by automation |
Total locked-in costs | Initial automation + ongoing consumables | High capital investment + perpetual operating costs |
Automation optimizes pallet handling. It doesn't optimize what happens to the merchandise on every trip: wrapping it in single-use plastic.
The ISPM-15 Compliance Industry
Mordor Intelligence reveals that the ISPM-15 framework "now spans 182 countries and levies roughly $45 million in annual penalties."
Let's examine what this creates:
The Compliance System:
International standards require heat-treated pallets
182 countries enforce the framework
$45 million in annual penalties worldwide
Pooling networks guarantee certified assets
What This Doesn't Address:
Heat treatment consumes significant energy
Certification adds cost to every pallet
Compliance creates barriers but doesn't reduce waste
System optimizes regulation adherence, not resource efficiency
The industry built a $45 million penalty enforcement mechanism. But nobody built a system that eliminates the need for disposable packaging on every compliant pallet shipment.
The 99.9% Hygiene Claim That Misses the Point
Research notes plastic pallets "cut bacterial contamination risk by 99.9% and perform reliably from -20°C to 40°C."
This is a genuine advantage for food and pharmaceutical applications. But consider what it ignores:
What Plastic Pallets Solve:
Non-porous surface prevents bacterial growth
Easy to clean and sterilize
No splinters or contamination from wood
Temperature stability across supply chain
What They Don't Solve:
Every load still wrapped in stretch film that cannot be sterilized between uses
Rental/pooling systems create contamination risk through multiple touchpoints
Single-use plastic waste generated on every shipment
Hygiene focused on pallet, not on packaging that touches every product
If contamination is the concern, why accept packaging that gets discarded after touching every item on the pallet?
The Brambles "Sustainability" Model
Mordor Intelligence highlights that Brambles (CHEP):
Sources 78% certified timber
Plants two trees for each harvested
Uses 550,000+ IoT trackers
Issued EUR 500 million green bond
This sounds like environmental leadership. But examine what it optimizes:
What Brambles Optimizes:
Sustainable timber sourcing for pallet production
Asset tracking for pooling efficiency
Tree planting to offset harvest
Green financing for expansion
What The Model Assumes:
Continuous pallet manufacturing is necessary
Rental/pooling circulation is optimal
Replacement cycles are inevitable
Stretch wrap consumption on every pallet turn is acceptable
They're running the most sustainable version of a consumption-based business model. That's different from eliminating consumption.
The Block Pallet Dominance Story
Block pallets hold 54.78% revenue share because they provide:
Four-way forklift access
Robotic compatibility
15-20% faster handling vs. stringers
Dimensional consistency for automation
But notice what "faster handling" actually means:
Industry Interpretation:
Pallets move through warehouse faster
Loading/unloading time reduced
Automation compatibility improved
Throughput increased
What It Doesn't Mean:
Faster handling of pallets that still need stretch wrap
Improved efficiency of assets that still need replacement
Optimized movement of goods that generate plastic waste every trip
You're handling consumption faster, not eliminating it.
The Rackable Pallet Reality
Rackable designs account for 44.86% of market share, enabling "40-50% higher storage density in high-bay racking."
This creates real warehouse efficiency gains. But consider the full picture:
Efficiency Gain | What It Optimizes | What It Ignores |
|---|---|---|
40-50% more storage | Warehouse space utilization | Every stored pallet was wrapped in plastic |
Better racking compatibility | Vertical storage efficiency | Stored goods sit in single-use packaging |
Structural integrity | Load safety on racks | Safety doesn't address consumption |
Higher density storage means storing more plastic-wrapped loads in less space. That's space efficiency, not resource efficiency.
The Asia-Pacific Growth Engine
Asia-Pacific leads with 44.66% market share, growing fastest at 6.23% CAGR due to:
Manufacturing hub consolidation in China and India
E-commerce acceleration in Southeast Asia
Cross-border asset rotation via pooling
Loscam pool expansion across region
Translation: The region consuming resources fastest is consuming more resources faster, while optimizing logistics to move consumption more efficiently.
The Growth Nobody Questions:
Hundreds of millions of new pallets annually
Billions of feet of stretch wrap consumed
Massive energy for production and distribution
Limited recycling infrastructure in developing markets
Market analysts celebrate this as "growth opportunity." But growth in what? Spending. Consumption. Resource extraction.
The Lumber Volatility That Reveals System Fragility
Research shows "a 14.54% duty on Canadian softwood swings wood input costs by as much as 40% per quarter."
This volatility matters because:
Wood holds 68.83% market share
Price fluctuations affect entire value chain
Manufacturers hedge purchases
Margin compression forces cost increases
But here's what volatility reveals: when your business model depends on continuous raw material extraction, you're vulnerable to every supply disruption and trade policy change.
Volatility Impact on Different Models:
Business Model | Lumber Price Increase | Impact |
|---|---|---|
Traditional wooden pallet manufacturer | 40% quarterly swing | Direct cost increase, margin compression |
Plastic pallet manufacturer | Indirect (via petroleum prices) | Still subject to commodity volatility |
Pallet rental/pooling operator | Affects replacement costs | Must absorb or pass through to customers |
PEER Pallets model | Zero impact after initial purchase | One-time material cost, no ongoing exposure |
The Nestable Pallet Optimization Paradox
Nestable pallets advance at 6.76% CAGR because they "cut empty-transport costs by as much as 70%."
Think about what this optimizes:
The Problem Nestable Pallets Solve:
Pallets travel full in one direction
Return empty after delivery
Empty transport wastes space and fuel
Nesting reduces return logistics costs
The Problem They Don't Solve:
Why do pallets need to return at all?
Why isn't the pallet an integrated asset that stays with merchandise?
Why accept a system requiring continuous circulation?
Nestable pallets are brilliant optimization of a flawed premise. They make it cheaper to move empty assets around. But why are we moving empty assets around?
The Medium-Duty Market Reality
Medium-duty pallets hold 49.55% share, accommodating 1,000-2,500 kg loads "typical of mainstream consumer-goods flows."
This represents the mass market. And the mass market assumptions:
Products need pallets for handling
Pallets need stretch wrap for stability
Both are consumed in the delivery process
Cycle repeats continuously
But what if the mass market adopted an integrated solution?
Volume Impact Analysis:
Market Segment | Share | If PEER Pallets Adopted |
|---|---|---|
Medium-duty (49.55%) | $45.6B annually | Eliminates ~$22B in stretch wrap costs |
High-duty (growing 6.15%) | Increasing share | Eliminates waste in growing segment |
Light-duty | Remaining share | Reduces waste in high-turnover applications |
The largest segment drives the most consumption. It also represents the largest opportunity.
The Pharmaceutical 8.53% Growth Story
Pharmaceutical and healthcare applications are growing fastest at 8.53% CAGR, driven by:
Temperature-controlled pools maintaining 2-8°C for 96 hours
Vaccine and biologics shipment requirements
Reusable insulated shippers
Specialty-drug cold chain demands
The sector prioritizes product safety and regulatory compliance. But examine what it accepts:
What Pharma Demands:
Sterile handling throughout supply chain
Temperature monitoring and validation
Product integrity from manufacturing to patient
Regulatory documentation and traceability
What Pharma Accepts:
Single-use stretch wrap that cannot be validated between uses
Pallet pooling introducing variables into controlled supply chains
Plastic waste generation despite sustainability goals
Multiple contamination touchpoints through rental networks
For an industry that validates every process variable, the tolerance for unvalidated single-use packaging is remarkable.
The Logistics & Warehousing Sector Dominance
Logistics and warehousing represent 34.92% of market share, reflecting:
Third-party logistics consolidation
Omnichannel distribution expansion
Multi-client pallet pooling
Share-and-reuse models
This sector understands efficiency. They measure:
Warehouse turns
Transportation costs per mile
Labor hours per unit handled
Space utilization metrics
But they don't measure:
Total cost of ownership including consumables
Plastic waste generated per delivery
True lifecycle costs of rental models
Value captured vs. value leaked to suppliers
The Recovery Rate Crisis
Research reveals "recovery rates below 40% in South America and Africa double ownership costs versus pooled models."
This matters because:
Poor reverse logistics makes rental economically unfeasible
Low recovery forces ownership model
Ownership without durability creates disposal challenges
Regions with weakest infrastructure face highest costs
Regional Disparity:
Region | Recovery Rate | Implication |
|---|---|---|
Developed markets | 70-80% | Pooling models viable |
South America/Africa | <40% | Pooling economics broken |
Asia-Pacific developing | Variable | Mixed model adoption |
The industry's "circular economy" works only where reverse logistics infrastructure exists. Everywhere else, it's linear consumption.
The Top 5 Companies Problem
Research notes "the top five suppliers account for about 25% of global capacity, signalling a moderately fragmented field."
This fragmentation means:
No dominant player can dictate industry direction
Innovation happens incrementally within existing model
Regional specialists optimize local consumption
Nobody has incentive to disrupt the replacement cycle
Market Structure Impact:
Fragmentation = optimization competition
Consolidation would = efficiency improvements
Disruption requires = business model change
The industry structure reinforces continuous improvement of the existing system rather than replacement of it.
The IoT Tracking Investment
Brambles uses "more than 550,000 IoT trackers to boost utilization and sustainability reporting."
This is genuine technological innovation. But examine what it optimizes:
What 550,000 IoT Trackers Enable:
Real-time pallet location tracking
Utilization metrics and optimization
Theft and loss prevention
Sustainability reporting for ESG goals
What They Don't Change:
Each tracked pallet still needs stretch wrap
Utilization improvements increase consumption rate
Better tracking doesn't eliminate replacement cycle
Sustainability reports measure optimization, not elimination
You're tracking consumption more accurately. You're not eliminating it.
The Customized Pallet Growth
Customized pallets grow at 7.28% CAGR as operators demand:
RFID inserts
Sensor slots
Deck surfaces tailored to conveyor coefficients
Hybrid constructions balancing performance and cost
This customization sounds like innovation. But consider what it optimizes:
Innovation Focus:
Better tracking (of consumable assets)
Improved handling (of items that need wrapping)
Enhanced automation (of repetitive consumption)
Material optimization (of products that become waste)
Nobody's customizing for elimination of consumables. Everyone's customizing for better consumption.
The PEER Pallets Position
Mordor Intelligence identifies what drives the $118.84 billion market:
Automation compatibility (block pallets, dimensional consistency)
Hygiene requirements (plastic, non-porous, cleanable)
Sustainability focus (certified timber, green bonds, IoT tracking)
Efficiency improvements (rackable density, nestable logistics)
Regulatory compliance (ISPM-15, pooling networks)
PEER Pallets delivers all of these—and adds what they ignore:
Market Driver | Industry Response | PEER Pallets Response |
|---|---|---|
Automation compatibility | Block pallets + RFID tracking | Block-compatible design + integrated solution eliminates pooling logistics |
Hygiene requirements | Plastic pallets (99.9% contamination reduction) | HDPE construction + cleanable reusable wrap (no single-use contamination) |
Sustainability | Green bonds + certified timber + tree planting | Zero ongoing consumables + full recyclability at true end of life |
Efficiency | Faster handling + better storage density | Eliminates handling of empty pallets + no return logistics |
Compliance | ISPM-15 certification + pooling guarantees | Compliance built-in + no circulation required |
We address every market driver. Then we eliminate what the market ignores: continuous consumption.
The Hidden Cost of "Smarter" Pallets
The industry invests in:
$200,000 automation calibration
$45 million ISPM-15 enforcement
EUR 500 million green bonds
550,000 IoT tracking devices
Bio-composite R&D programs
All to optimize a system that:
Generates $118.84 billion in spending annually
Consumes billions of tons of stretch wrap
Requires continuous raw material extraction
Assumes perpetual replacement
Here's the alternative calculation:
Total Addressable Market (2031): $118.84 billion Stretch wrap portion (estimated 30% of operational costs): ~$35.65 billion Available for capture if consumption eliminated: Substantial
The market is massive because the problem is massive. And the problem persists because the industry optimizes it instead of solving it.
The Bottom Line
Research projects $118.84 billion in market value by 2031, driven by automation, sustainability, and efficiency improvements.
But examine what that value represents:
Companies spending billions on smarter consumption
Automation investments locked into existing model
Sustainability programs optimizing resource extraction
Efficiency gains accelerating consumption rate
PEER Pallets doesn't participate in the optimization race. We eliminate the consumption that creates the market.
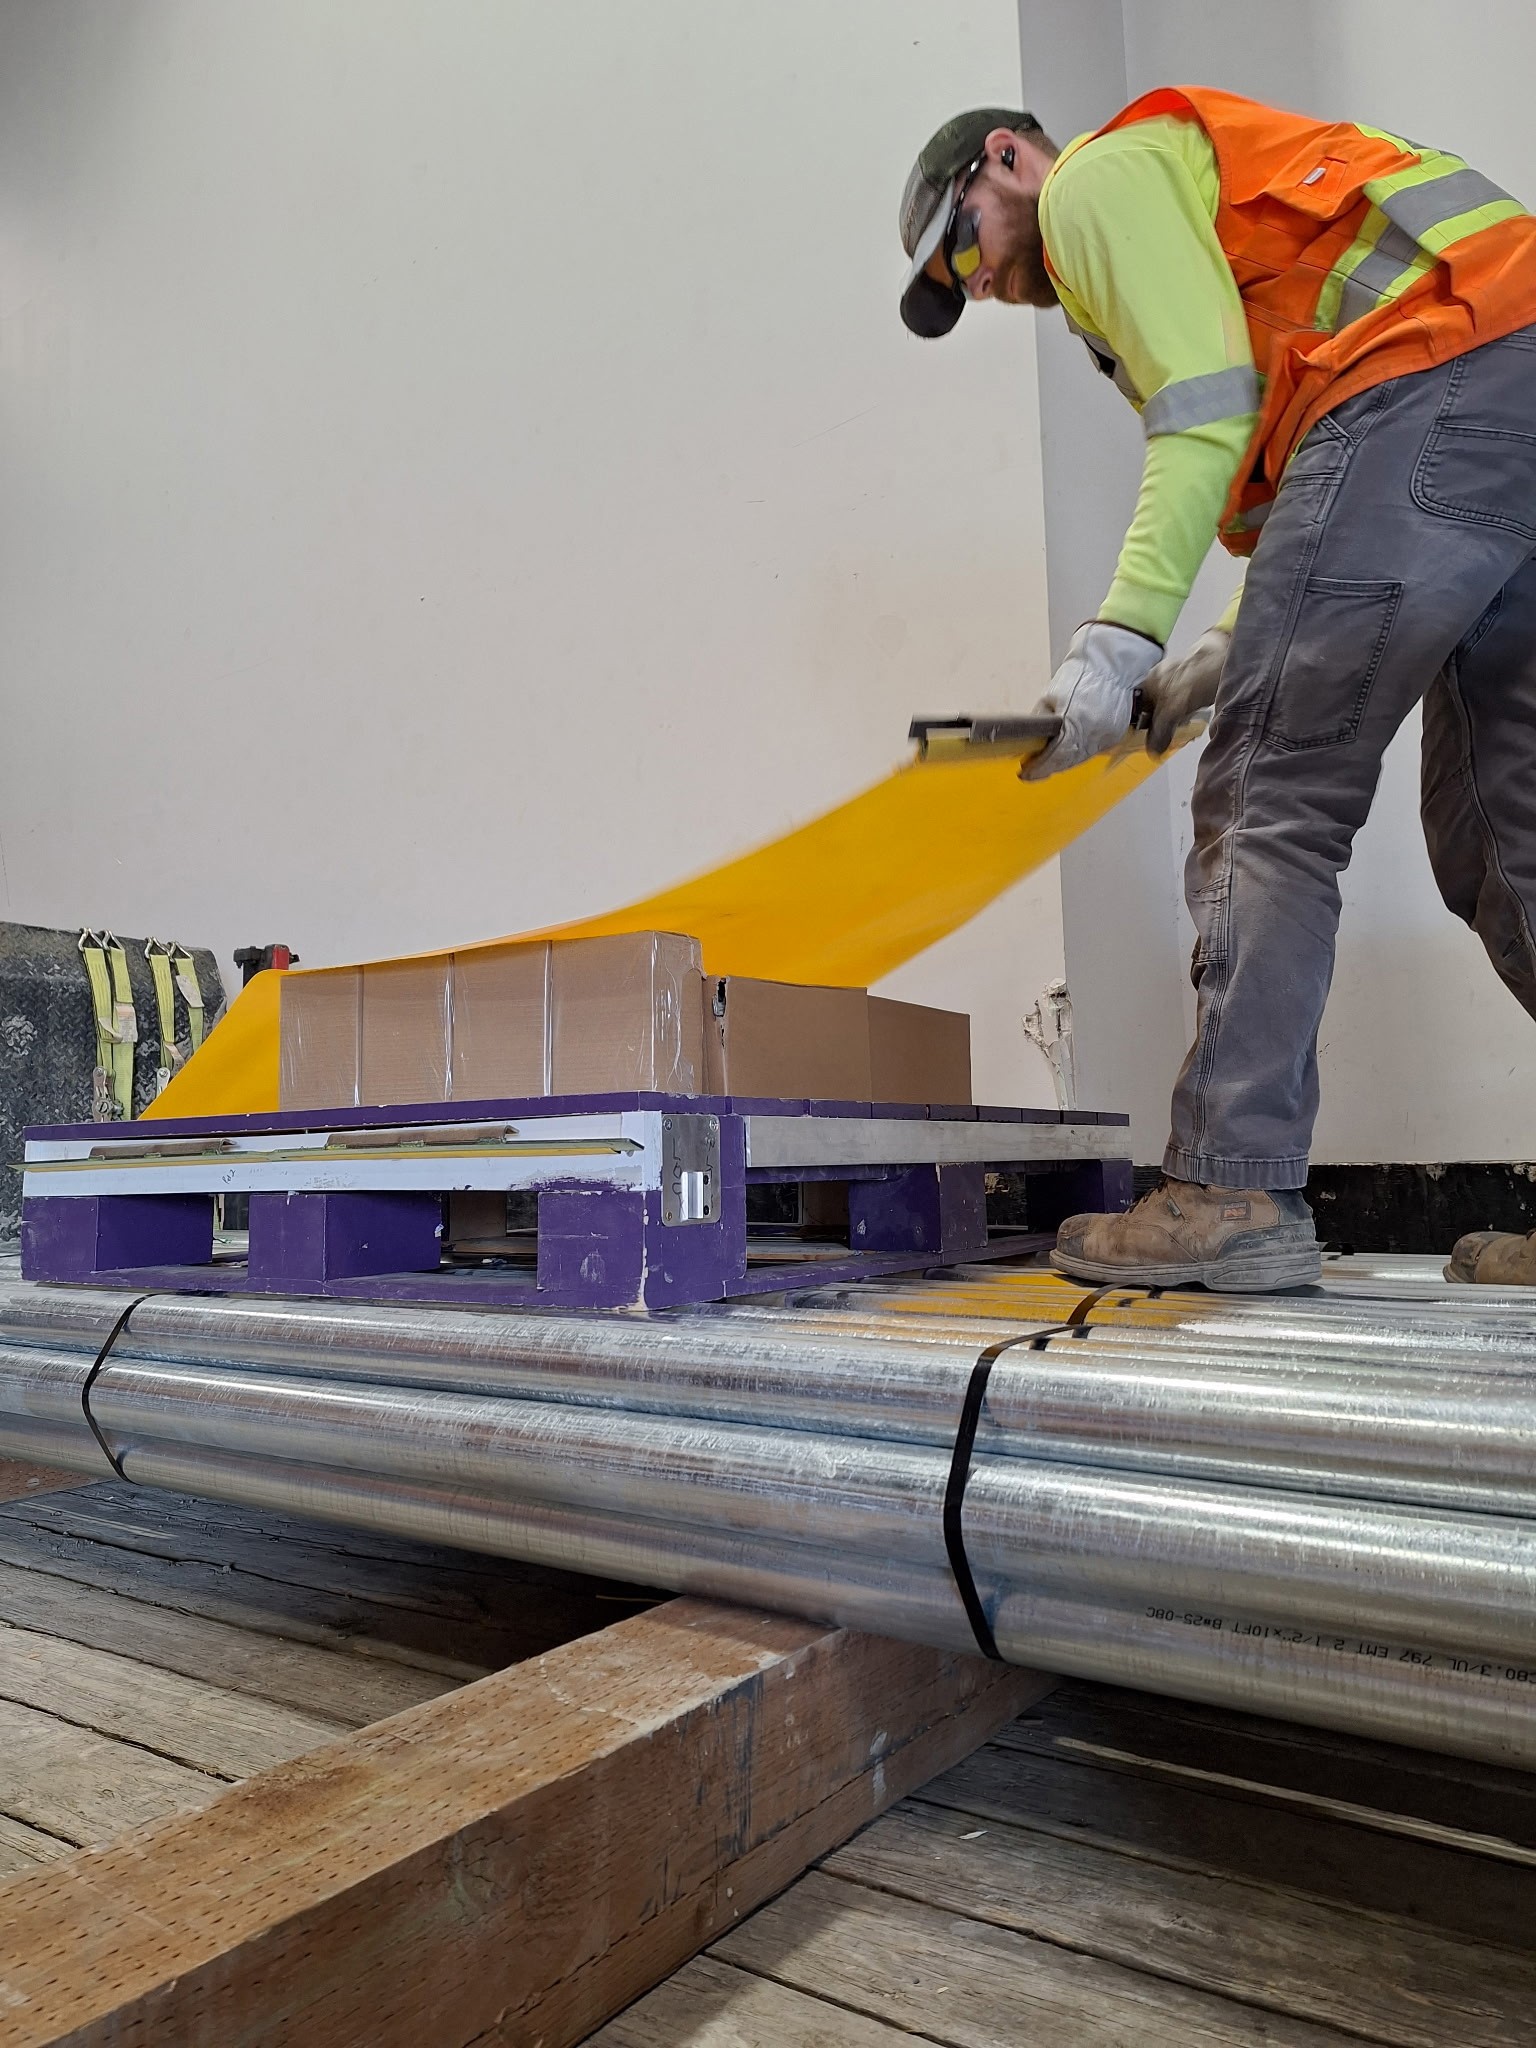
Ready to stop investing in smarter consumption and start eliminating it? Contact PEER Pallets to learn how our integrated system delivers automation compatibility, hygiene, and sustainability without the $118.84 billion in recurring costs.